
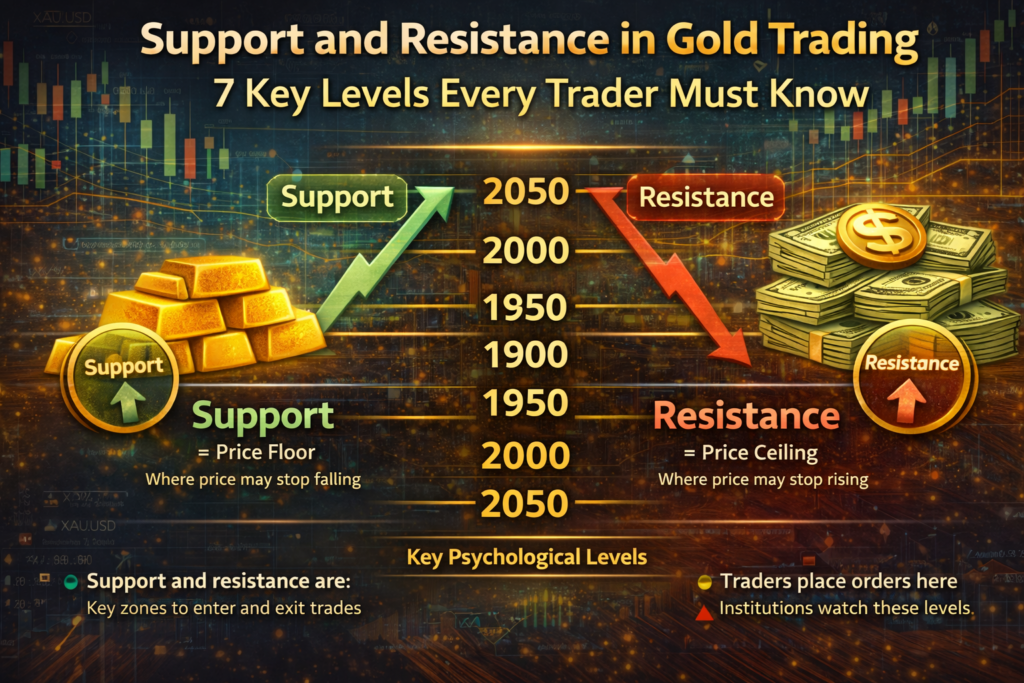
Support and resistance in gold trading is one of the most important concepts every trader must learn. These key levels help identify where price may reverse, react, or continue trending in XAU/USD. This support and resistance in gold trading strategy is widely used by professional traders to improve accuracy and reduce risk.
Many beginners struggle with gold trading because they enter trades randomly without identifying important market levels. Learning how to draw support and resistance correctly helps traders read charts more clearly and avoid poor entry points.
In this guide, you will learn:
- What support and resistance in gold trading means
- How to identify key levels on XAU/USD charts
- How to use these levels for entry, stop loss, and take profit
- Common mistakes beginners should avoid
What Is Support in Gold Trading and Why It Matters?
Support in gold trading is a price level or zone where the market tends to stop falling and may bounce upward.
Support forms because buyers become active in that area and demand increases.
👉 Think of support as a price floor that gold struggles to break.
Example:
If gold drops to 2000 and repeatedly bounces from that level, then 2000 becomes a strong support zone.
What Is Resistance in Gold Trading in XAU/USD?
Resistance is a price level or zone where gold tends to stop rising and may reverse downward.
Resistance forms because sellers become active and supply increases.
👉 Think of resistance as a price ceiling.
Example:
If gold rises to 2050 multiple times but fails to break above it, then 2050 becomes a resistance zone.
Why Support and Resistance in Gold Trading Works
Support and resistance in gold trading works effectively because:
- Traders place buy and sell orders at key levels
- Institutions defend important price zones
- Psychological levels attract attention
- Gold trends strongly between major zones
How to Identify Support and Resistance in Gold Trading
Step 1: Look for Repeated Reactions
If price touches an area and reverses multiple times, that level is important.
Step 2: Mark Swing Highs and Lows
- Swing highs → resistance
- Swing lows → support
Step 3: Use Higher Timeframes
Strong levels appear on:
- H4
- Daily
- Weekly
Key Psychological Levels in Gold Trading
Gold often reacts strongly to round numbers such as:
- 1800
- 1850
- 1900
- 1950
- 2000
- 2050
- 2100
Types of Support and Resistance in Gold Trading
Horizontal Support and Resistance
The most common type, formed when price reacts at the same level multiple times.
Dynamic Support and Resistance
Moving averages:
- 50 MA
- 100 MA
- 200 MA
Trendline Support and Resistance
Used in trending markets.
Role Reversal in Gold Trading
- Old support → becomes resistance
- Old resistance → becomes support
Example:
Gold breaks above 2000 → retests → 2000 becomes support.
How Traders Use Support and Resistance in Gold Trading Strategy
Support and resistance in gold trading strategy is used in multiple ways:
Entry Points
Buy at support, sell at resistance.
Stop Loss
Below support or above resistance.
Take Profit
Target next key level.
Breakout Trading
Strong break = new trend.
Breakouts and Fake Breakouts in Gold Trading
Gold is known for fake breakouts.
Why:
- High volatility
- Stop-loss hunting
- Institutional activity
Confirmation:
- Strong candle close
- Retest
- Continuation
Best Timeframes for Beginners
- H1
- H4
- Daily
Common Mistakes
❌ Too many levels
❌ No confirmation
❌ Ignoring higher timeframe
❌ Treating levels as exact lines
Simple Method
- Daily → levels
- H4 → refine
- H1 → entry
- 3–5 level focus
Candlestick Confirmation
- Pin bar
- Engulfing
- Doji
- Breakout candle
Why Levels Fail
- News (CPI, NFP, FOMC)
- Volatility
- Strong trend
👉 Always use risk management.
Combining With Other Tools
- RSI
- Fibonacci
- Trendlines
- Market structure
Learn More About Gold Trading
If you want to improve your trading skills, check our detailed guide:
👉 https://spacefxpro.com
You can track real-time gold prices and market data here:
👉 https://www.investing.com
You can also analyze charts and price movements on TradingView:
👉 https://www.tradingview.com
Final Thoughts
Support and resistance in gold trading is one of the most powerful tools for analyzing price action. By focusing on key zones and waiting for confirmation, traders can significantly improve their results.
FAQ
Does support and resistance in gold trading work?
Yes, especially on H4 and Daily charts.
What are the most important gold levels?
1900, 1950, 2000, 2050, 2100.
Should beginners use it?
Yes, it is one of the best strategies.